
pure sine wave inverter test card
pure sine wave inverter test header

Pure Sine Wave inverter test

目录

A pure sine wave inverter test has to answer two different questions, and most guides only answer the first: is this inverter genuinely producing a sine wave, and does it stay a sine wave when a real load, a sagging battery, and a hot enclosure all hit it at once. The label on the box means nothing until you have put a number on the output and attached a measurement condition to that number. At Impedyme, we validate power electronics for a living, and we see the same pattern constantly — an inverter that looks flawless at no load collapses into visible distortion the moment a switch-mode power supply or a motor is connected. This guide walks through the complete pure sine wave inverter test workflow, from a two-minute quick check you can do with basic instruments, to a defensible bench characterization with real pass/fail criteria, to closed-loop hardware-in-the-loop validation for teams who need repeatable, standards-referenced proof. If you want the broader context first, our inverter test pillar covers the full family of inverter validation methods.

the pure sine wave inverter test sequence

Run a pure sine wave inverter test in this order — each step builds on the one before it:

  1. Inspect wiring, terminals, and insulation, and confirm the DC input is within the inverter’s rated range before powering up.
  2. Capture a no-load baseline of output voltage, frequency, and waveform shape as your reference point.
  3. Sweep a linear (resistive) load from 25 to 100 percent of rating and record voltage THD, RMS voltage, and frequency at each step.
  4. Apply a non-linear reference load with a realistic crest factor — this is the pure sine wave inverter test step that actually separates true sine wave units from marketing claims.
  5. Step the load suddenly up and down and measure how far the voltage dips and how fast it recovers.
  6. Push the inverter into overload and short circuit to confirm its protection trips correctly and recovers.
  7. Run a thermal soak at full load until temperatures stabilize, then re-measure THD and voltage to catch derating.

What a pure sine wave inverter test actually measures

“Pure sine wave” is a marketing phrase until you translate it into measurable quantities. A true sine wave inverter test rests on four measurable pillars: voltage total harmonic distortion, waveform-shape ratios (crest factor and form factor), frequency and voltage regulation, and DC offset. None of these numbers means anything on its own — each is only meaningful with a stated load, load type, and DC input condition attached.

Voltage THD, and why the load condition matters more than the number

Total harmonic distortion of the output voltage is the single number that correlates most strongly with “grid-like” power. It expresses how much harmonic content rides on top of the fundamental 50 or 60 Hz sine. Quality pure sine wave inverters are commonly specified with voltage THD below 3 percent, and the best hold well under that.

Here is the problem with almost every published pure sine wave inverter THD test: the number is quoted with no conditions. THD at no load is nearly meaningless, because with nothing drawing current the output filter has an easy job and almost any half-decent inverter looks clean. The distortion appears under load — specifically under non-linear load, where the current is drawn in narrow high peaks that the inverter’s output stage struggles to supply without the voltage waveform sagging at its crest. A THD figure without a stated load percentage, load type, and DC input voltage is not a specification; it is a decoration. Every THD number produced by a credible inverter waveform test must carry those three conditions.

Crest factor and form factor as waveform-shape indicators

Crest factor is the ratio of a waveform’s peak value to its RMS value. For a mathematically perfect sine wave, crest factor is always 1.414 — the square root of two — regardless of amplitude. If you measure the output voltage crest factor of an inverter and it reads meaningfully below 1.414, the waveform is flat-topped (clipped at the peak); if it reads well above, the wave is peaky. Either way, the departure from 1.414 is a fast, load-dependent indicator of distortion.

Form factor, the ratio of RMS value to the average of the rectified waveform, is 1.11 for a pure sine. Form factor is the quiet hero of low-cost sine wave inverter output testing, because it is exactly the constant that cheap meters bake into their circuitry — and, as we explain below, that is what lets a two-meter comparison expose distortion.

Frequency and voltage regulation limits

A pure sine wave inverter should hold its output frequency and RMS voltage tightly as the load and DC input change. Good standalone inverters regulate steady-state output voltage to within a couple of percent, and premium double-conversion designs specify steady-state voltage regulation as tight as plus or minus 1 percent. Frequency on a crystal-referenced inverter is typically held within a fraction of a percent. The test that matters is not whether these hold at a single operating point, but whether they hold across the full DC input range and the full load range simultaneously.

Typical pure sine wave inverter test thresholds

The table below gives defensible target thresholds with their measurement conditions attached. Treat these as engineering starting points; the authoritative numbers for any given product are whatever its datasheet declares and whatever the governing standard requires.

参数ConditionTypical target for a true pure sine wave inverter
Voltage THDNo loadUnder 2 percent (least meaningful figure)
Voltage THDRated linear (resistive) loadUnder 3 percent
Voltage THDReference non-linear load, crest factor ~3Under 5 percent
Crest factorAny load1.40–1.42 (ideal 1.414)
Frequency toleranceFull load and DC rangeWithin about ±0.1 to ±0.5 percent
Voltage regulationSteady state, 0–100 percent loadWithin about ±1 to ±3 percent
DC offsetAny loadA few hundred millivolts at most; ideally near zero

How to Test a Pure Sine Wave Inverter?

This is the heart of the article. A rigorous pure sine wave inverter test procedure is a sequence of ten steps, each with a defined purpose, setup, what to record, and a pass/fail criterion. Run them in order — each builds on the last, and skipping the early ones puts your instruments and your people at risk.

Step 1 — Visual, wiring, and insulation checks

Purpose: Confirm the unit is safe to energize and that nothing will introduce false readings or hazards. Setup: With everything de-energized, inspect terminals, torque connections to spec, verify conductor sizing, and check the chassis ground bond. Perform an insulation resistance check between input, output, and chassis. Record: Insulation resistance values, torque confirmation, any physical damage. Pass/fail: Insulation resistance meets the manufacturer’s and the applicable safety standard’s minimum; no loose connections; a solid protective earth. Fail here and you stop — there is no point measuring waveforms on an unsafe unit.

Step 2 — DC input verification and input range sweep

Purpose: Prove the inverter behaves across its entire DC input window, not at one convenient voltage. Setup: Feed the inverter from an adjustable DC source (a programmable supply or a battery emulator) rather than a single fixed battery. Sweep the DC input from the low-voltage cutoff, through nominal, to the high-voltage limit. Record: Output voltage, frequency, and THD at each DC input point at a fixed moderate load. Pass/fail: Output stays within regulation limits and THD stays within target across the whole DC range. This step routinely exposes inverters that are clean at nominal battery voltage but distort badly near the low-battery cutoff, when the DC bus ripple grows and the output stage runs out of headroom.

Step 3 — No-load output voltage, frequency, and waveform baseline

Purpose: Establish a clean reference before loading. Setup: Inverter energized, no load, differential probe on the output (see safety section). Record: RMS voltage, frequency, waveform capture, no-load THD, crest factor, and — importantly — standby/no-load DC draw. Pass/fail: Voltage and frequency at nominal; waveform visually sinusoidal. Remember this is your easiest condition; passing here proves very little on its own but gives you the baseline every later step of the pure sine wave inverter test is compared against.

Step 4 — Linear load sweep at 25, 50, 75, and 100 percent

Purpose: Characterize behavior under well-understood resistive loading. Setup: A resistive or programmable AC load bank set to draw 25, 50, 75, and 100 percent of rated power. Hold each step long enough for readings to settle. Record: At each step — RMS voltage, frequency, voltage THD, crest factor, input DC power, and output AC power for the efficiency assessment in Step 9. Pass/fail: Voltage regulation and THD stay within target at every step, with no sudden degradation as load rises. A linear load draws current in the same shape as the voltage, so this inverter load test is fair but gentle — an inverter that cannot stay clean here is not a pure sine wave unit in any sense.

Step 5 — Non-linear load test with realistic crest factor

Purpose: This is the test that actually separates true pure sine wave inverters from marketing claims. Setup: Apply a reference non-linear load — the classic definition is a diode bridge rectifier feeding a smoothing capacitor through a small series resistor, with a load resistor across the DC side, sized to produce a current crest factor of about 3. A programmable AC load in rectified/crest-factor mode reproduces the same behavior repeatably. Record: Voltage THD, crest factor, and waveform capture at 50 and 100 percent of rated apparent power. Pass/fail: THD stays within the non-linear target (commonly under 5 percent) and the voltage waveform shows no gross flat-topping at the peak.

Why do cheap inverters fail here while passing every earlier step? A non-linear load — every switch-mode power supply, LED driver, laptop charger, and TV — draws current only near the voltage peak, in tall narrow pulses. Supplying that pulse without the voltage sagging demands a stiff output stage and a fast control loop. Undersized inverters cannot deliver the peak current, so the top of the sine gets clipped, THD shoots up, and connected electronics see distorted power. We have watched inverters that advertise clean sine output distort violently the instant a modest computer power supply is connected. If you run only one step of this pure sine wave inverter test, run this one.

Step 6 — Step-load and transient response

Purpose: Measure dynamic regulation — how the inverter reacts to sudden load changes. Setup: Switch the load abruptly between defined points (for example 0 to 100 percent, and 20 to 100 to 20 percent) for both resistive and non-linear loads while capturing the output on a scope. Record: Peak voltage dip and overshoot, and the recovery time back to within tolerance. Pass/fail: As a reference, IEC 62040-3 Class 1 requires the output voltage to recover within 200 milliseconds after a 0-to-100 percent or 100-to-0 percent step load change, with the transient voltage deviation held within plus or minus 10 percent of nominal. Excessive dips cause connected equipment to reset or drop out even though the inverter never “failed.”

Step 7 — Overload, inrush, and short-circuit protection

Purpose: Confirm the inverter survives and protects itself against abnormal loads. Setup: Apply defined overloads above 100 percent, a high-inrush load (such as a motor or a load with a large input capacitor), and a controlled output short. Record: Overload duration before trip, behavior during motor-start inrush, short-circuit trip time, and whether the unit recovers or latches off. Pass/fail: The inverter rides through rated surges, trips cleanly on genuine overload and short circuit within its declared times, and either restarts or latches per its specification — without damage. This is a step where physical inverter testing carries real destructive risk, which is exactly why the HIL and PHIL sections below matter.

Step 8 — Thermal soak and derating behavior

Purpose: Reveal how the inverter behaves once it is hot, not just in the first cold minute. Setup: Run at full rated load (and ideally at elevated ambient) until case, heatsink, and transformer temperatures stabilize. Record: Temperatures over time, plus periodic re-measurement of voltage, frequency, and THD; note any automatic power derating or fan behavior. Pass/fail: The inverter holds its output specifications hot, derates gracefully and as documented rather than shutting down abruptly, and never exceeds safe temperatures. Many inverters that pass every cold measurement quietly derate or increase distortion after 30 minutes at full load.

Step 9 — Efficiency and standby power at defined load points

Purpose: Quantify how much energy the inverter wastes converting DC to AC, and how much it burns doing nothing. Setup: Using the DC input power and AC output power captured in Step 4, determine efficiency at 25, 50, 75, and 100 percent load. Efficiency, described in plain words, is simply the fraction of the DC power going in that emerges as useful AC power out — the closer to 100 percent, the less is lost as heat. Separately, measure the standby draw with the inverter on but unloaded. Record: Efficiency at each load point and standby power. Pass/fail: Efficiency meets the datasheet within measurement tolerance; standby draw is low — typically a small fraction of rated power. Peak efficiency for good units sits in the low-to-mid 90s of a percent; standby for an off-grid inverter is often in the range of ten to a few tens of watts. This pure sine wave inverter efficiency test is where paper specifications most often fail to survive contact with a meter.

Step 10 — Protection functions and shutdown thresholds

Purpose: Verify every declared protection actually fires at the right threshold. Setup: Individually exercise low-battery warning and shutdown, high-battery/over-voltage shutdown, over-temperature shutdown, and any ground-fault or reverse-polarity protection. Record: The measured threshold and response for each function against its specified value. Pass/fail: Each protection activates within its declared window and the unit annunciates the condition. A pure sine wave inverter test is not complete until the safety behaviors are proven, not just the waveform.

Test record template — what to log for traceability

Waveform quality claims are only defensible if someone else can reproduce them. For every test point, log: date, operator, and inverter serial/firmware version; ambient temperature; DC input voltage and source type; load percentage and load type (linear or non-linear, with crest factor); measured RMS voltage, frequency, voltage THD, and crest factor; instrument models, bandwidth, and calibration dates; and the raw waveform capture file reference. This record is what turns a set of readings into traceable evidence.

pv inverter test

Pure sine wave inverter test procedure: ten-step summary

步骤目的Pass criterion
1. Visual/insulationSafe to energizeInsulation and bonding meet spec
2. DC input sweepBehavior across full DC rangeIn-spec output low-to-high DC input
3. No-load baselineReference pointNominal V/Hz, sinusoidal shape
4. Linear sweepBehavior under resistive loadRegulation and THD in spec at 25–100%
5. Non-linear loadExpose real-world distortionTHD under target with crest factor ~3
6. Step/transientDynamic regulationDip and recovery within class limits
7. Overload/shortProtection under faultClean trip and recovery, no damage
8. Thermal soakHot-state behaviorHolds spec hot; graceful derate
9. Efficiency/standbyEnergy performanceMeets datasheet; low idle draw
10. ProtectionsSafety thresholdsEvery protection fires on target

Quick checks: how to test if an inverter is pure sine wave without a lab

Not everyone has a bench. These methods can build or destroy confidence quickly, but each has hard limits — and knowing what a method cannot prove is as important as knowing what it can.

Oscilloscope on the output — the only direct inverter waveform test

An oscilloscope is the only way to see the waveform directly, and a genuine pure sine looks like a smooth sinusoid while a modified sine shows an obvious stepped, blocky shape. But connecting a scope to a live AC inverter output is where people destroy equipment and hurt themselves. Read the safety section below before you do this. Done correctly with a differential probe, the scope tells you shape at a glance; with the scope’s math functions you can also read THD and crest factor.

The true-RMS versus average-responding meter comparison, done correctly

There is a widespread and flatly incorrect claim that a true-RMS meter “reveals” a bad waveform by reading erratically or low. That is wrong, and it is worth being precise because getting this right is a genuine authority signal. A true-RMS meter reads the correct RMS value regardless of waveform shape — that is the entire point of it. It will not flag distortion by misbehaving, because it does not misbehave.

The correct low-cost technique is a comparison. Measure the same inverter output with two meters at once: a true-RMS meter and an ordinary average-responding meter (the cheaper kind, internally calibrated to display RMS by assuming a sine and applying the 1.11 form-factor constant). On a genuine pure sine wave, both meters agree closely. On a distorted or modified-sine output, the average-responding meter’s built-in sine assumption breaks down and its reading diverges from the true-RMS meter — published instrument guidance puts that error as much as 40 percent low or 10 percent high depending on the waveform. A meaningful gap between the two readings is your evidence of distortion, and the size and direction of the divergence hints at the waveform type. This version of a true sine wave inverter test costs two handheld meters and proves far more than either meter alone.

Incandescent bulb and transformer-hum checks, and their limits

An old-fashioned incandescent bulb runs smoothly on a sine and can flicker or buzz on a distorted wave; a small mains transformer or a cheap AC motor often emits a louder, harsher hum on a distorted output than on a clean one. These sensory checks are quick and free. Their limit is that they are qualitative — they can suggest gross distortion but cannot confirm a 3-percent-THD claim, cannot attach a number to anything, and can be fooled. Use them to raise suspicion, never to certify.

Reading the nameplate and datasheet critically

The most underrated part of any pure sine wave inverter test is reading the datasheet properly. A THD spec almost always omits the conditions that make it meaningful: at what load, what load type, and what DC input? “THD under 3%” with no load stated is very likely a no-load figure — the flattering one. Look for THD quoted at rated load and, ideally, at a reference non-linear load; look for voltage and frequency regulation stated across the DC input range; look for a declared standby draw and an efficiency curve rather than a single peak number. What a spec omits tells you as much as what it states.

Pure sine wave inverter test bench setup and measurement safety

Instruments required

A defensible bench needs, in generic terms: a digital oscilloscope with adequate bandwidth; a high-voltage differential probe rated for the output; a power analyzer or power quality analyzer for THD, power, and efficiency; a true-RMS meter and an average-responding meter for the comparison check; a programmable DC source or battery emulator for the input sweep; and a programmable AC load or load bank capable of both resistive and non-linear (crest-factor) profiles. We deliberately name no brands — categories are what matter.

Differential probes, isolation, and floating outputs — the mistake that damages equipment

This is the single most important safety point in the whole procedure. A standard oscilloscope’s probe ground clip is connected, through the scope’s power cord, to earth ground. An inverter output is frequently floating or line-referenced, not earth-referenced. Clip a normal probe ground onto an inverter’s live or neutral and you can create a direct short through the scope chassis to earth — destroying the probe, the scope, and potentially injuring the operator. Never do it.

The correct method is a high-voltage differential probe, which measures the voltage between two points without referencing either to earth and rejects the common-mode voltage safely. An isolated-input oscilloscope achieves the same end. “Floating” the scope by defeating its earth ground is dangerous and must not be done. Any instruction to clip a scope directly across a live inverter output with no mention of isolation — as some published guides unfortunately give — is simply wrong and unsafe.

Bandwidth, sample rate, and window length for meaningful harmonic measurement

To run an inverter THD test honestly you must capture the harmonics, not just the fundamental. Harmonic content of interest typically extends to the 40th or 50th harmonic, so your instrument’s bandwidth and sample rate must comfortably cover that range — a measurement chain that rolls off too early will report a flatteringly low THD. Capture over several full cycles so the analysis window contains enough periods for a stable harmonic spectrum, and let readings settle before logging. Measurement conditions — bandwidth, window, load — belong in the test record alongside the numbers.

DC source and load selection

Use a DC source that can be swept across the inverter’s full input range and that can reproduce battery-like behavior, not just a stiff bench supply. Choose an AC load that can present true resistive loading a controllable non-linear profile with a defined crest factor, because Step 5 is impossible with a resistive load bank alone. This is exactly where programmable emulation begins to outclass a fixed physical load.

Standards that govern pure sine wave inverter testing and power quality

Standards turn “it looked clean” into “it complies.” Which standards apply to your pure sine wave inverter test depends heavily on whether the inverter is standalone/off-grid or grid-interactive.

StandardScopeWhat it constrainsTypical application
IEEE 519Harmonic control in power systemsVoltage and current harmonic/TDD limits at the point of common couplingGrid-tied / DER; system-level
IEC 61000-3-2Harmonic current emissions, equipment ≤16 A/phaseIndividual harmonic current limits up to the 40thEquipment connected to public LV grid
IEC 61000-4 seriesImmunity test methods (e.g. -4-4 EFT, -4-5 surge, -4-11 dips)How equipment must withstand disturbancesAny mains-connected equipment
IEC 62040-3UPS performance and test methodsOutput classification, transient limits, reference non-linear loadUPS and inverter output characterization
IEC 62109-1 / -2Safety of PV power conversion equipmentShock, fire, thermal, abnormal operationPV inverters (grid-tied, off-grid, hybrid)
UL 1741 标准Inverters/converters for DERProduct safety plus grid-support function validationNorth American DER interconnection
IEEE 1547 标准DER interconnection and interoperabilityHow a DER must behave on the gridGrid-interactive products only
UL 458Mobile/marine power invertersSafety for vehicle and marine installationsRV, mobile, marine standalone inverters
IEC 62477-1Safety of power electronic converter systemsGeneral converter safety up to 1500 V DC / 1000 V ACBroad power-converter safety framework

A few clarifications that matter. IEEE 519 is a system-level harmonic recommendation defined at the point of common coupling and expressed largely in terms of total demand distortion for current; on the voltage side, the 2022 edition sets, for a PCC bus at or below 1.0 kV, an individual harmonic voltage limit of 5.0 percent and a total voltage distortion limit of 8.0 percent. It applies to grid-connected installations, not to a standalone off-grid inverter’s output in isolation. IEC 61000-3-2 limits individual harmonic currents an appliance injects and applies to equipment drawing up to 16 A per phase. IEC 62040-3 is the UPS standard, and it is the most useful reference for waveform work because it defines a reference non-linear test load and output-performance classes with explicit transient limits. UL 1741 and IEEE 1547 apply only to grid-interactive / distributed-energy-resource products — they are irrelevant to a pure off-grid inverter except where you intend to sell into a grid-tied application. UL 458 governs mobile and marine inverters. IEC 62109-1/-2 are PV inverter safety standards covering grid-interactive, stand-alone, and multi-mode units.

On the reference non-linear load specifically: the IEC 62040-3 reference non-linear load is a diode bridge rectifier feeding a smoothing capacitor through a series resistor with a parallel load resistor, defined to produce a current crest factor of about 3, with roughly two-thirds of the load’s apparent power as fundamental active power and the remainder capacitive/harmonic in the classic 1999/2011 definition. The 2021 edition changed this: the non-linear step load is no longer a type test, and non-linear load requirements were relaxed in the annex for consistency with the IEC 61000-3 harmonic standards. If you cite a specific crest factor or power split in a test report, cite it against the edition you are working to.

Where bench-based pure sine wave inverter testing stops being enough

Everything above is real, valuable work — and it has genuine technical limits that no amount of care on a physical bench can remove.

Some conditions are unsafe or impossible to create repeatably with real hardware. Deliberately driving an inverter into repeated short circuits, or forcing an internal switch fault, stresses and eventually destroys real devices, and each destructive event happens slightly differently, so results scatter. Sweeping the DC input across the full battery state-of-charge and temperature range with real batteries means waiting for real charge/discharge cycles and real thermal soaks — days per point, and impossible to hold perfectly steady. Grid disturbances — voltage sags, frequency excursions, phase jumps — cannot be conjured on demand at a wall outlet, and creating them with real fault hardware is hazardous. And every time firmware changes, you would ideally re-run the entire pure sine wave inverter test campaign for regression; doing that on a physical bench is slow, expensive, and throughput-limited. Physical benches are also destructive-risk-limited: you cannot afford to blow up ten units to characterize a protection threshold ten times. These are not reasons to abandon the bench; they are the precise boundary where hardware-in-the-loop takes over.

Controller HIL testing for pure sine wave inverters

Hardware-in-the-loop testing replaces the physical power environment with a real-time digital simulation while keeping the real controller hardware in the loop. For a pure sine wave inverter, controller HIL means the inverter’s control board runs against a simulated power stage, output filter, load, and source — with no real high power involved.

What gets modeled

The real-time model represents the switching power stage, the LC output filter that turns the PWM chopping into a smooth sine, the load (linear or non-linear, with whatever crest factor you choose), and the DC source. The controller thinks it is driving real hardware; in fact it is driving a faithful digital twin that you can reconfigure in seconds.

Why time step and FPGA resolution decide whether your results are trustworthy

This is where the physics gets unforgiving. A pure sine wave inverter’s waveform quality is created by PWM switching at several kilohertz to tens of kilohertz, smoothed by the output filter. If your simulation time step is too coarse, the model cannot place the PWM edges accurately, and every harmonic conclusion drawn from it is suspect. Published analysis of real-time simulation loops shows that a 25-microsecond time step can carry as much as 20 percent relative error against an 8 kHz PWM, while the same simulation at 1 microsecond drops to well under 1 percent. The peer-reviewed literature draws the same line: accurate power electronic simulation with a PWM control strategy should run under 1 microsecond — territory that requires FPGA-based execution rather than a CPU. On Impedyme’s FPGA-based platform, model updates run as fast as 90 nanoseconds and PWM gate edges are captured at nanosecond-scale resolution, which is what makes the emulated waveform’s harmonic content trustworthy enough to test against a THD limit.

Testing control firmware directly

Controller HIL lets you exercise the firmware itself — the PWM generation, the closed-loop voltage and frequency regulation, and the protection logic — under conditions you fully control. You can watch how the control loop responds to a modeled non-linear load, whether it maintains regulation as the modeled DC bus sags, and whether its protection state machine trips correctly, all without risking a single real component.

Automated fault injection and regression suites

Because the environment is simulated, faults are just parameters. You can inject a short, an open switch, a sensor fault, or a grid disturbance on a schedule, repeat it identically a thousand times, and re-run the entire pure sine wave inverter test campaign automatically after every firmware change. This turns regression testing from a multi-week hardware exercise into an overnight automated run — the single biggest reason validation teams adopt HIL.

Power HIL (PHIL): pure sine wave inverter testing against an emulated world

Power hardware-in-the-loop goes a decisive step further: the real, fully powered inverter runs against an emulated electrical environment, exchanging actual voltages and currents with programmable power hardware driven by the real-time model. You get the realism of full-power testing with the controllability of simulation. Our Power Hardware-in-the-Loop overview explains the architecture in depth.

Emulating the DC source across state of charge, temperature, and aging

Instead of a real battery, a real-time battery emulator presents the inverter with the exact terminal behavior of a pack at any state of charge, any temperature, and any state of health — and can traverse that entire range in minutes rather than days. The DC input sweep of Step 2 becomes a scripted, repeatable procedure rather than a week of charge cycles.

Emulating grid and AC loads, including programmable non-linear profiles

A grid and AC load emulator can present the inverter with any load — resistive, motor-like, or a non-linear profile with a precisely defined crest factor — and can change it on command. The non-linear load test of Step 5, the hardest part of a pure sine wave inverter test to reproduce consistently with physical load banks, becomes a repeatable software-defined profile.

Running standards-derived disturbance profiles repeatably

Voltage sags, frequency excursions, phase jumps, and harmonic injection derived from grid-code and power-quality standards can be replayed identically, every time, on demand. That repeatability is precisely what a bench cannot offer and what an audit trail requires.

Measuring waveform quality under conditions a bench cannot reproduce

With the real inverter delivering real power into an emulated world, you can finally measure THD, crest factor, and transient response under a low-battery input, a hot pack, and a distorting non-linear load simultaneously — the worst-case corner that reveals whether an inverter is truly pure sine wave, and the corner a manual bench almost never reaches safely.

Building a repeatable pure sine wave inverter test plan

A defensible pure sine wave inverter test program is designed, not improvised. Start with a test matrix that crosses load percentage and type against DC input voltage and temperature, so every meaningful corner has a defined cell. Accept that full coverage of that matrix on physical hardware costs more time than any schedule allows — which is the argument for automation: script the campaign so it runs unattended and identically every time. Put data management at the center: every result carries its measurement conditions, firmware version, and instrument calibration, stored so it is queryable and comparable across builds. Define regression triggers — every firmware change, every hardware revision, every supplier change re-runs the affected matrix cells automatically. Finally, correlate simulation with the bench: validate your real-time model against measured hardware at a few anchor points, then trust the model to explore the corners the bench cannot safely or affordably reach. That correlation is what lets an audit accept simulated evidence.

How Impedyme supports pure sine wave inverter testing

We build the FPGA-based real-time platforms that turn the workflow above into a repeatable, automated, traceable pure sine wave inverter test program. Each product maps to a capability you have just read about.

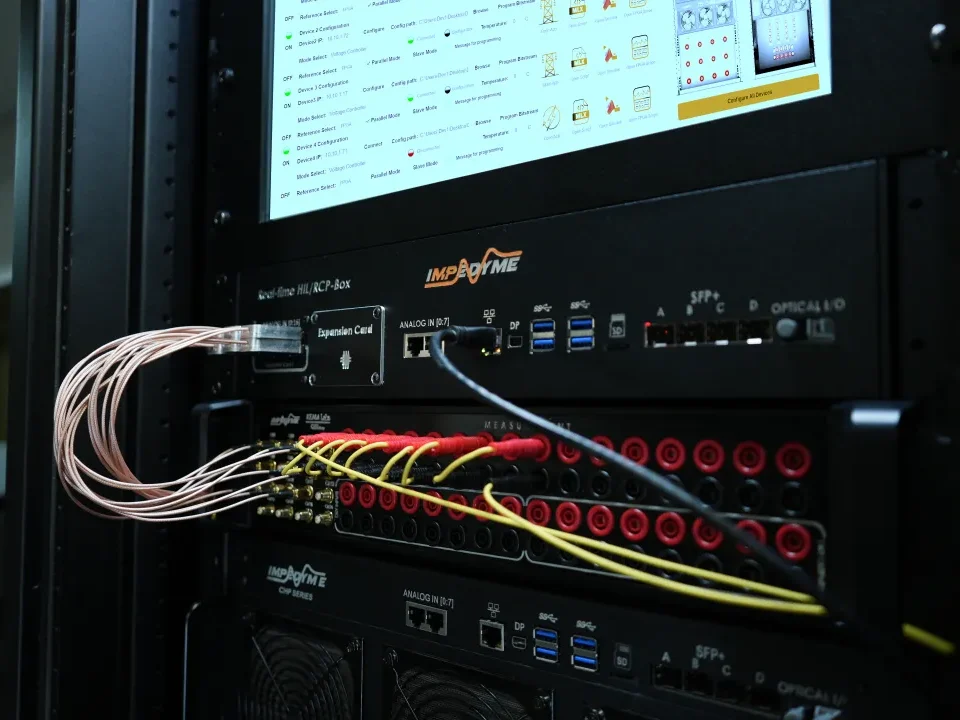
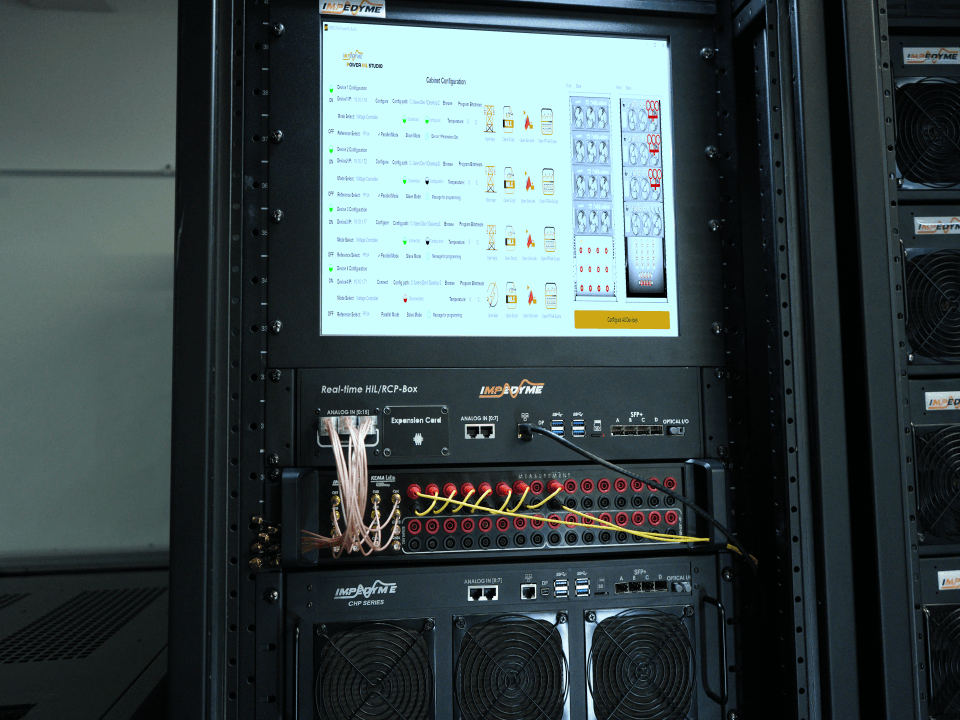
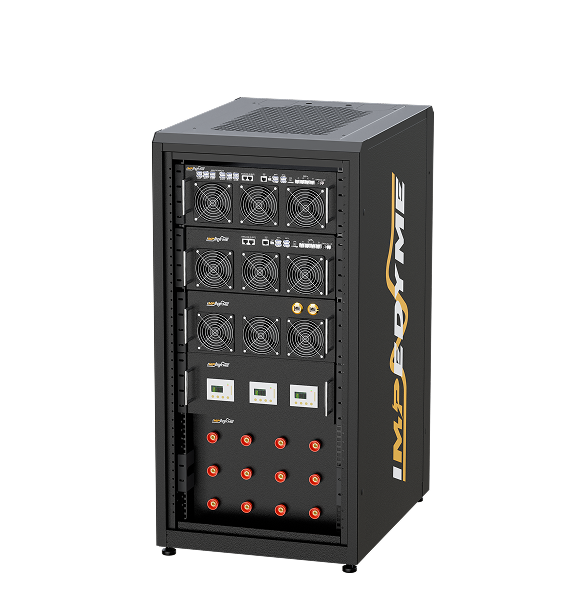
CHP Series platform. 我们 CHP Series combines signal-level HIL and full-power regenerative PHIL in one architecture, available in half- and full-cabinet configurations and scalable by paralleling. Its simulation time steps reach as low as 90 nanoseconds — the resolution that makes emulated inverter harmonics trustworthy — so your waveform-quality results mean something.

PowerHIL Studio. PowerHIL Studio, is the orchestration and automation layer. It configures the hardware, scripts entire test campaigns, coordinates multi-emulator setups, and generates reports from one MATLAB-integrated environment — turning a multi-week regression into an overnight run.

GridSim Studio. GridSim Studio drives grid and AC-load emulation, letting you present the inverter with programmable non-linear loads, voltage sags, frequency excursions, and harmonic injection built from grid-code scenarios — repeatably, every time.

Real-Time Battery Emulator. 我们 Real-Time Battery Emulator presents the inverter’s DC input as a pack at any state of charge, temperature, and state of health, so the full input-range sweep runs in minutes instead of days.

FPGA Scope. FPGA Scope provides built-in, sub-microsecond, multi-channel waveform visualization synchronized to the model, so you can see PWM edges and harmonic behavior with the resolution the physics demands.

Impedyme Simulink Blockset. Our Simulink blockset carries your models straight from desktop simulation into real-time execution on the CHP hardware, so the model you validate against the bench is the model you run in the loop.

Frequently Asked Questions 

1. How do you test if an inverter is a true pure sine wave? Put an oscilloscope with a differential probe on the output to see the shape directly, and measure voltage THD under load with a power analyzer. As a low-cost cross-check, compare a true-RMS meter reading against an average-responding meter on the same output — a genuine sine makes them agree, while distortion makes them diverge. Always test under load, not just no load.

2. What THD is acceptable for a pure sine wave inverter? Quality units are commonly specified below 3 percent voltage THD, but the number is meaningless without conditions. Expect under about 2 percent at no load, under 3 percent at rated resistive load, and under about 5 percent at a reference non-linear load with a crest factor near 3. Always demand the load, load type, and DC input at which any THD figure was measured.

3. Can you run a pure sine wave inverter test with just a multimeter? Partly. Two multimeters — one true-RMS, one average-responding — let you detect distortion by comparing their readings on the same output; a meaningful gap indicates a non-sinusoidal wave. But a multimeter cannot show you the waveform, cannot quantify THD, and cannot capture transient behavior. It is a screening tool, not a substitute for an oscilloscope and power analyzer.

4. Why does a pure sine wave inverter distort under load? Non-linear loads such as switch-mode power supplies draw current in tall, narrow pulses near the voltage peak. Supplying that peak current without the voltage sagging demands a stiff output stage and a fast control loop. Undersized or cheap inverters cannot, so the sine gets flat-topped at its crest, THD rises, and the distortion appears exactly when a real non-linear load is connected.

5. Is it safe to connect an oscilloscope to an inverter output? Only with a high-voltage differential probe or an isolated-input scope. A normal probe’s ground clip is tied to earth through the scope; an inverter output is often floating or line-referenced, so a direct connection can create a short through the scope chassis, destroying equipment and endangering the operator. Never “float” the scope by defeating its earth ground.