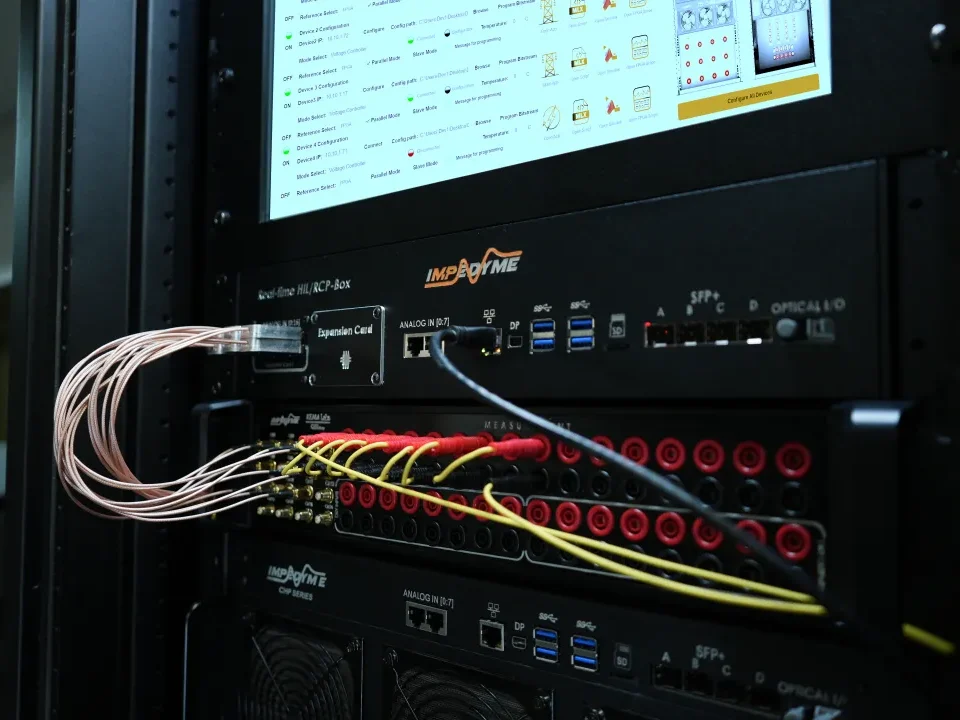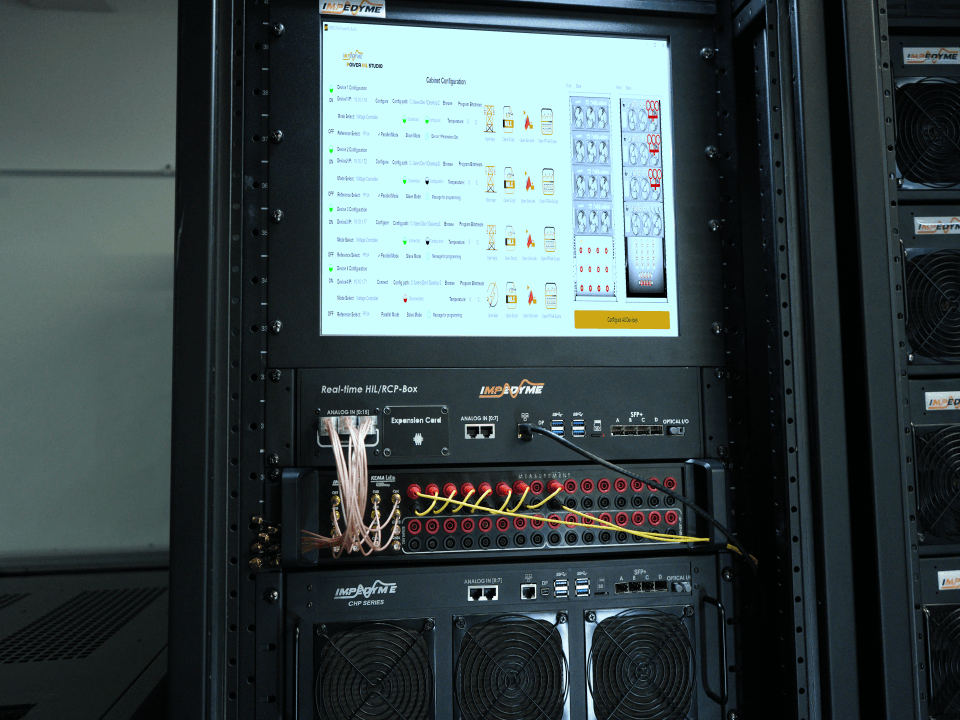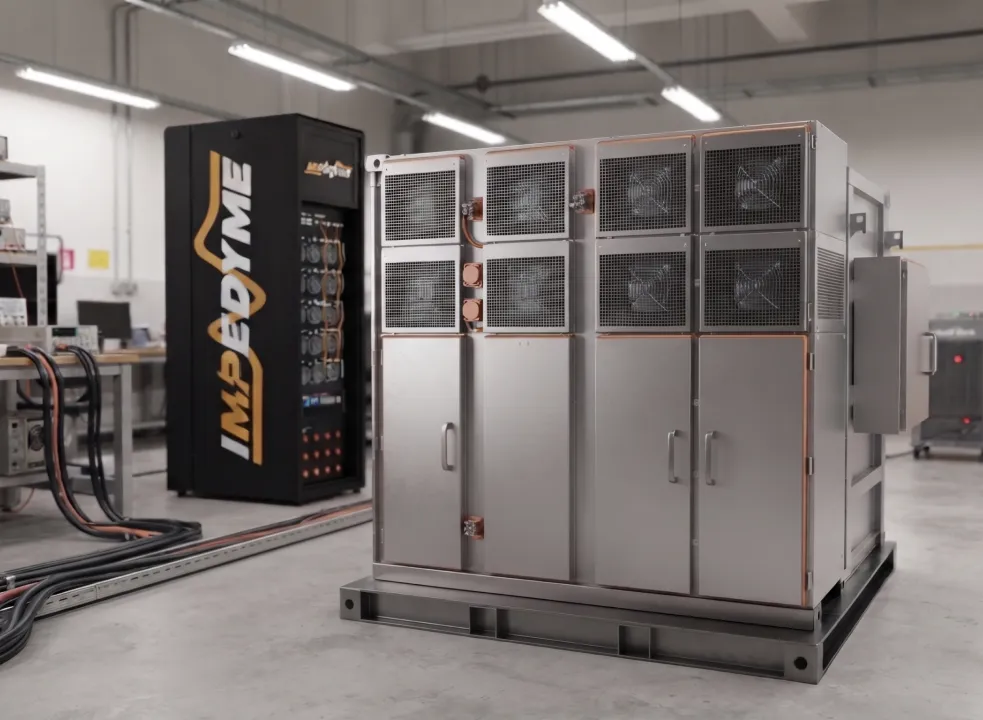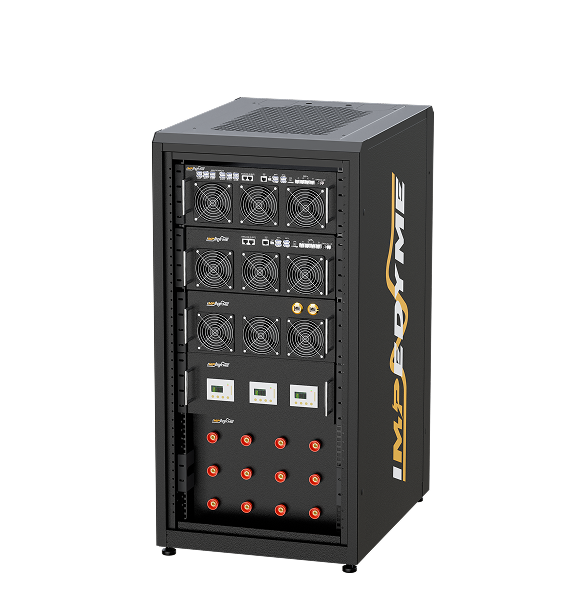

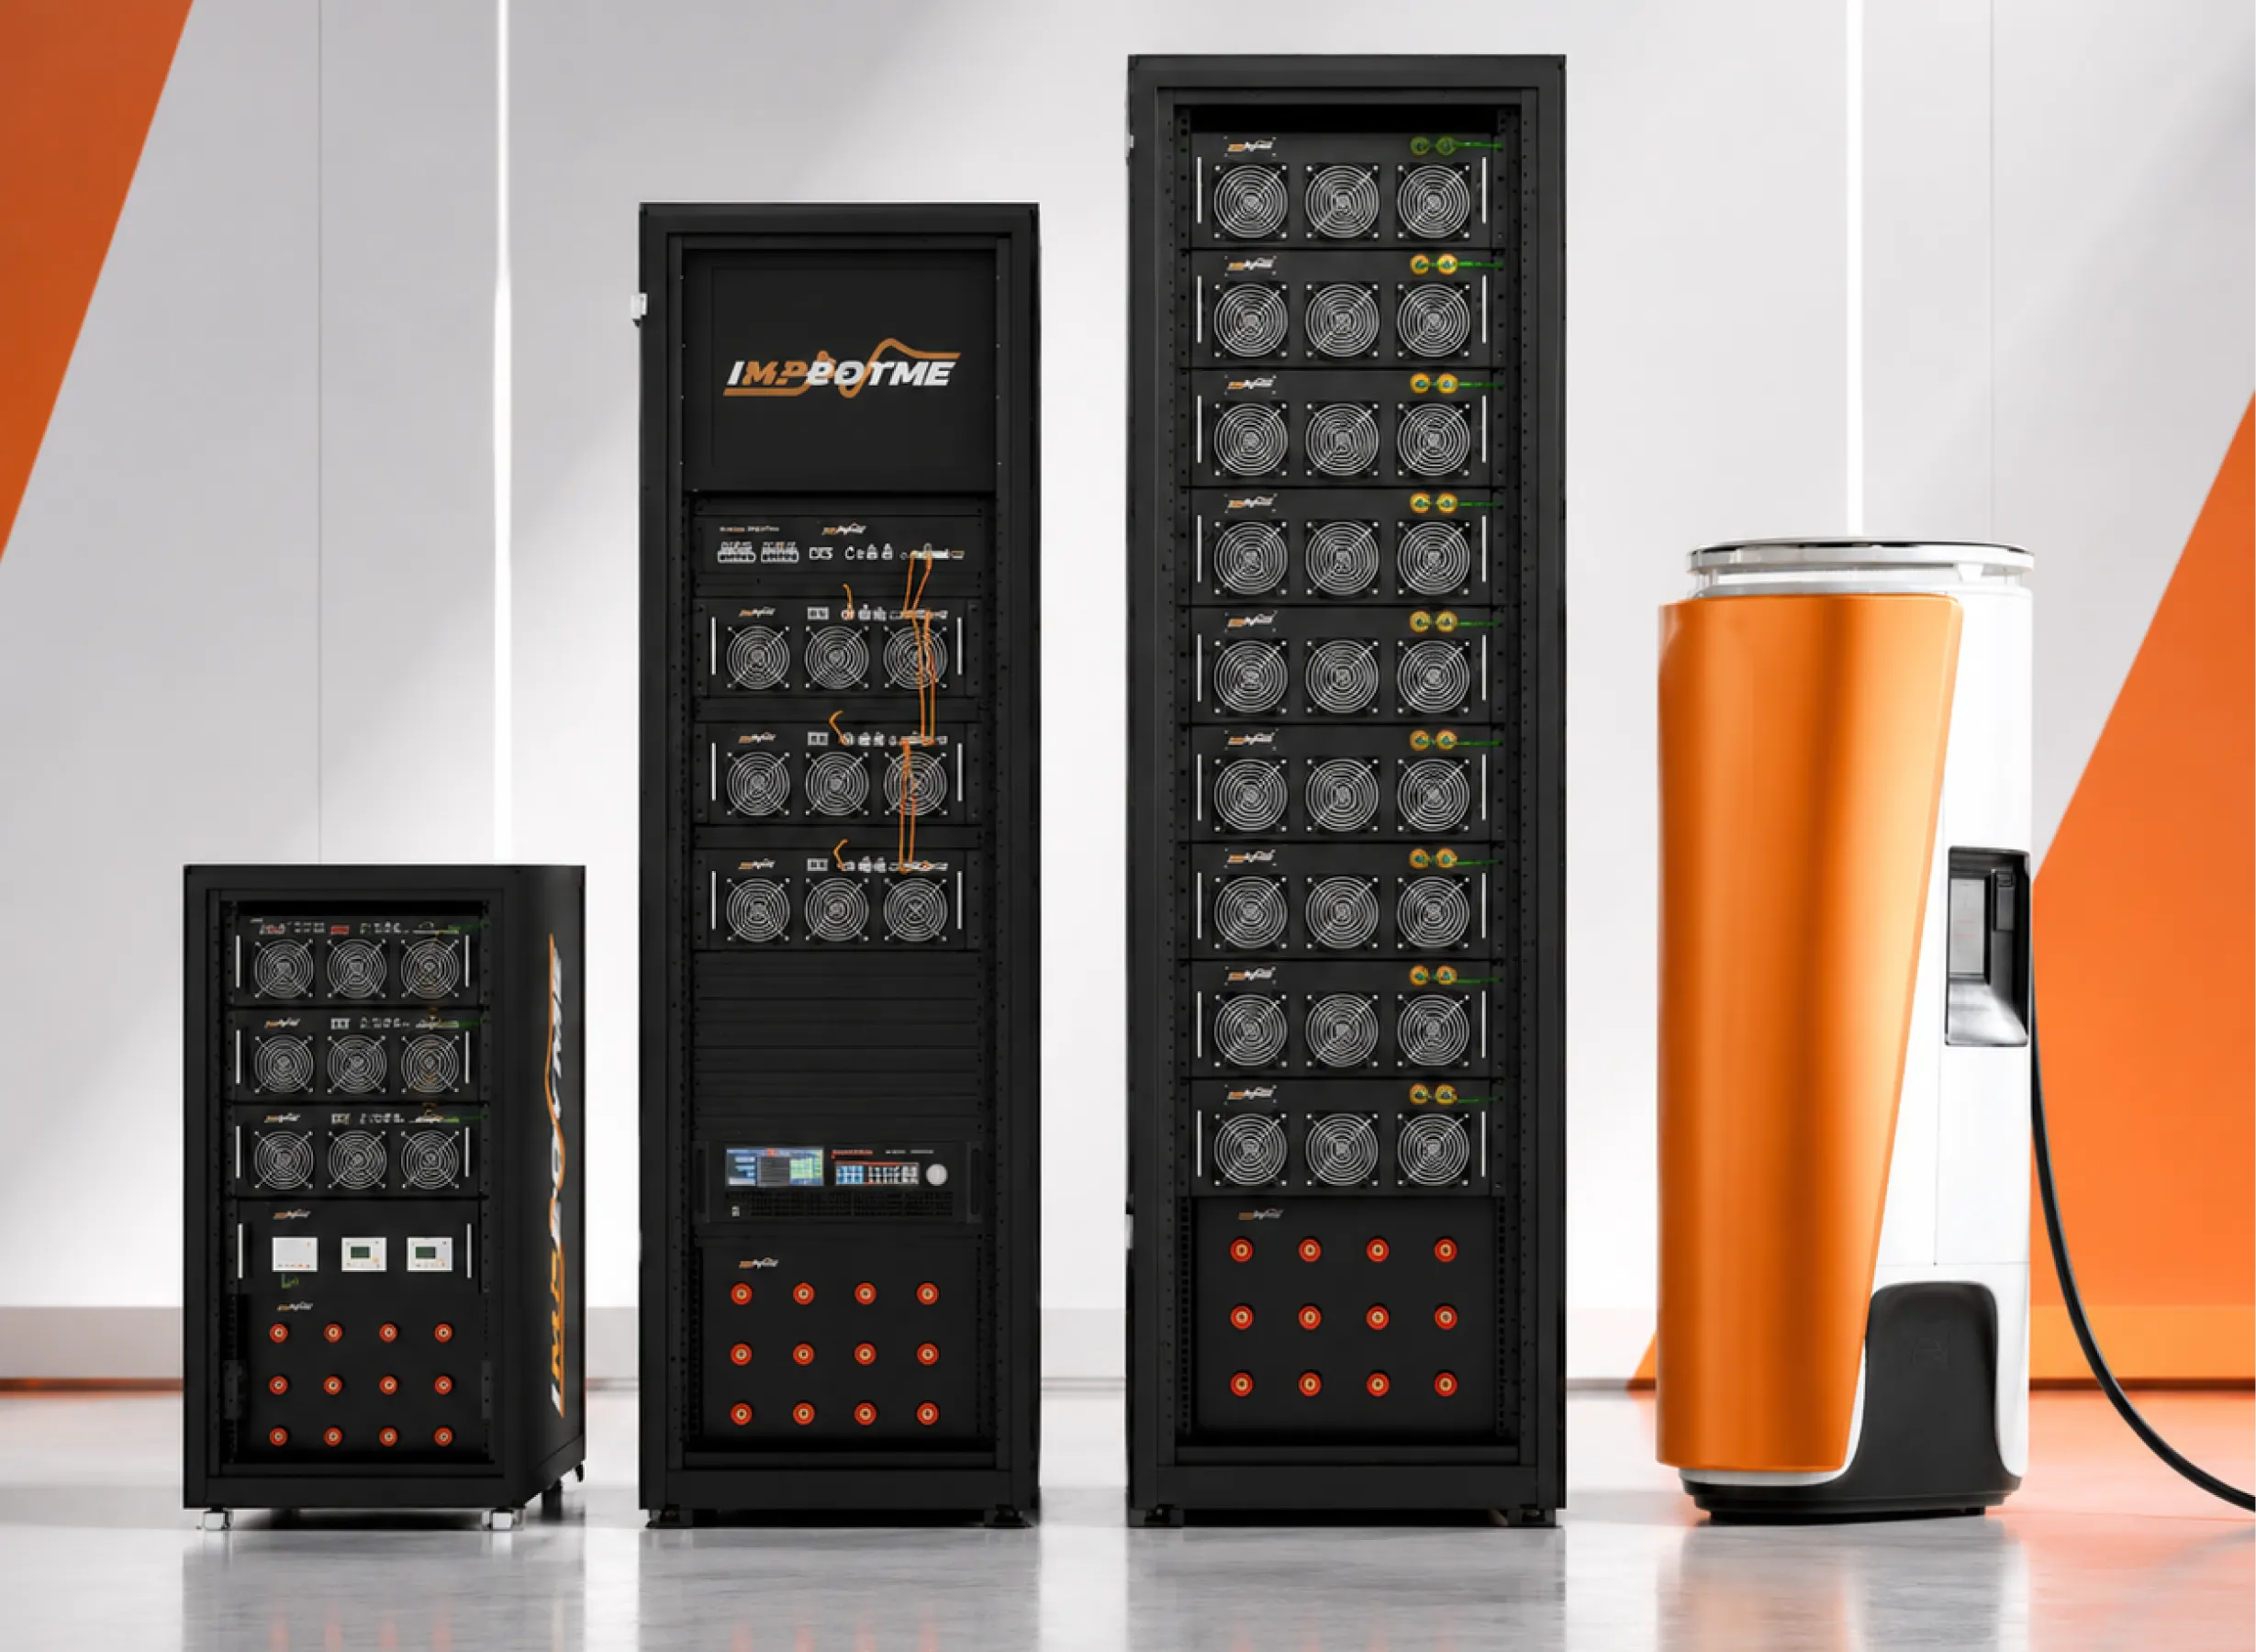
server dc converter testing header card

应用知识电网电机产品知识响应式菜单

server dc converter testing header

DC-DC 变换器测试:确保效率与可靠性

DC-DC 变换器测试是一门学科,其目的是证明一个功率变换器在它将要面对的每一种运行工况下,都能高效、可靠、安全地做到其数据表所承诺的一切。一个在单一测试点看起来完美的变换器,可能会在不同负载下振荡,可能会在真实直流偏置下输出电容降额时损失一半的相位裕度,或者可能会在一个从未对其进行过表征的机箱内部因过热而关断。一套严谨的 DC 变换器测试方案的任务,就是在实验室里、而不是在现场发现这些失效。

在 Impedyme,我们打造工程团队用来更快、且风险更低地验证电力电子产品的硬件在环和功率模拟工具。本指南将带你走遍 DC-to-DC 变换器测试的完整版图——核心测量项、需求如何随拓扑结构变化、服务器 DC 变换器测试的具体要求,以及 电力硬件在环(PHIL) 如何重塑现代变换器的验证方式。

为什么 DC-DC 变换器测试很重要

每一个把一种直流电压转换为另一种直流电压的电子系统,都依赖于变换器行为的可预测性。在电动汽车中,一个 DC-DC 级把牵引电池降压,为 12 V 和辅助电源轨供电。在 AI 服务器中,一连串级联的变换器把 48 V 降到 1 V 以下、以数千安培的电流为 GPU 供电。在无人机中,电子调速器(ESC)及其供电轨必须在不让飞行控制器掉电的情况下承受剧烈的瞬变。

变换器的失效很少能够被局限住。一个不稳定的控制环会注入噪声,破坏一条敏感的模拟电源轨。一个缓慢的瞬态响应会导致处理器在负载阶跃下崩溃。一个未被发现的保护阈值错误,会把一次例行故障变成一块被烧毁的电路板。全面的 DC-DC 变换器测试之所以存在,正是为了在这些相互作用失效蔓延之前将其捕获——而功率越大、代价越高,这种测试就必须越彻底。

核心的 DC 变换器测试方法

一次完整的 DC-to-DC 变换器测试活动,并不是单一的一次测量。它是一整套相互补充的测试,每一项都揭示变换器行为的一个不同侧面。最强的测试方案会在整个输入电压和负载范围内运行其中的每一项,而不是只在单一的额定点进行。

效率

效率是最引人注目的数字,而它出人意料地难以准确测量。由于效率是输出功率与输入功率之比,损耗只是两个大数值之间的一个微小差额。要把一个 95% 效率变换器的损耗解析到 5% 以内,就必须在两个端口上把电压和电流测量到约 0.06% 的精度。这就要求采用四线开尔文检测以消除引线电阻误差、电压和电流同步采集,以及经过严格表征的分流器或传感器。

电学方法——同时测量输入和输出端的电压 V 和电流 I——涵盖了绝大多数情况。对于效率超过 99% 的变换器,当电学精度已无裕量可用时,对耗散热量进行量热测量就成为更值得信赖的方法,它不受在极高效率下困扰电学方法的相位和时序误差影响。无论采用哪种方法,效率都应在负载和输入电压上进行扫描,并绘制成一条曲线,因为一个为峰值效率而优化的变换器,可能会在轻载时崩溃。

电压调整率与负载调整率

负载调整率衡量的是在固定输入电压下、当负载被扫描时,输出漂移了多少。电压调整率衡量的是在固定负载下、当输入电压被扫描时,输出的漂移量。两者都以相对于规格的百分比偏差来报告,且都依赖四线检测,从而测量的是变换器的调整率、而非测试引线的电阻。

输出纹波与噪声

输出纹波处于毫伏量级,这意味着测量技术主导着测量结果。最佳做法是把示波器带宽限制在 20 MHz,采用探针尖-筒(即「回形针」)连接方式以尽量减小接地环路,并在探测点处加一个小的电容网络——常见的做法是把一个 10 µF 钽电容与一个 0.1 µF 陶瓷电容配对——以表征真实的本地去耦。纹波和噪声应在整个输入范围内、满载条件下采集,而频谱分析则可揭示开关基频及其谐波。

负载瞬态响应

真实的负载并不会缓慢变化。一个处理器可以在数微秒内从空闲跳变到满负荷取电,而变换器必须在这一阶跃过程中把输出保持在调整率范围之内。负载瞬态测试施加一个快速的负载阶跃,并测量输出电压的偏差(下冲和过冲)以及恢复到调整范围所需的恢复时间。

这个阶跃必须真正够快——它的上升时间必须远短于变换器的环路响应——否则它根本无法充分激励控制环,从而揭示不出任何问题。一个足够陡峭的负载阶跃是 DC-DC 变换器测试中最强大的诊断工具之一,恰恰是因为它能同时在很宽的频带上激励控制环,从而暴露出临界稳定性、输入电源振铃以及布局寄生问题,而这些是静态测量永远无法呈现的。

控制环与稳定性测试

稳定性是许多变换器悄然失效的地方。最权威的测试方法是测量闭环变换器的开环传递函数:通过在反馈路径中的一个串联电阻上注入一个小的交流信号,并用频率响应分析仪对其进行扫频,从而绘制出一张伯德图。从这张图上,你可以读出穿越频率、相位裕度、增益裕度以及穿过 0 dB 时的增益斜率。一些有用的经验法则是:穿越频率约为开关频率的十分之一、相位裕度至少 45°,以及穿越点处为 −20 dB/十倍频程的斜率。

稳定性并不是一个固定不变的属性。裕度会随负载和温度变化,也会随着你可能意想不到的元件而变化——一个多层陶瓷输出电容在真实直流偏置下可能会损失远超一半的标称电容,从而把环路带宽拉高、并使相位裕度坍缩到其数据表值的一小部分。一个在室温和额定偏置下通过测试的变换器,在现场可能只是临界稳定。此外还有一种系统级的失效模式:当为变换器供电的源阻抗相对于变换器的输入阻抗并不小时,即便变换器本身在孤立状态下完全正常,其前端也可能发生振荡。这种相互作用对于任何使用理想台式电源作为源的测试来说都是不可见的。

软启动、保护与热测试

还有另外三项测试可以让一套彻底的方案更加完整。 启动和软启动测试 会验证开机时间、受控的浪涌电流、无过冲的单调输出爬升,以及在一系列负载和输出电容下正确的上电时序。 保护测试 会确认过流(OCP)、过压(OVP)、过温(OTP)、短路以及欠压锁定等行为是否在正确的阈值上触发并正确恢复——这些测试会逼近变换器的损毁极限,因此采用能量受限的测试接口会很有价值。 Thermal testing places thermocouples at the hottest junctions (switching FETs, transformer, rectifier, PCB), controls airflow and orientation, and builds derating curves, because dissipation changes with input voltage and the converter must stay below its thermal limits everywhere it operates.

DC-DC Converter Testing by Topology

The test plan above is universal, but each topology stresses different parts of it.

  • Buck (step-down): The workhorse. Focus on regulation, efficiency across load, current-mode loop stability and slope compensation, capacitor DC-bias derating, and fast-transient behavior for point-of-load rails.
  • Boost (step-up): The right-half-plane zero fundamentally limits achievable loop bandwidth, so stability characterization and inductor current-stress testing take priority.
  • Buck-boost / SEPIC: Wide input range means testing must cover the full Vin span, with attention to the noise and regulation trade-offs near the transition region.
  • Flyback: Isolated and low-power; test transformer leakage, snubber design, cross-regulation between outputs, and ripple.
  • LLC resonant: Soft-switching delivers high efficiency, but gain and efficiency vary strongly with switching frequency and load, and light-load efficiency suffers from circulating current. Characterize the gain curves, the ZVS boundaries, and frequency control across the full load and line range.
  • Phase-shifted full bridge (PSFB): Test the zero-voltage-switching range, circulating current, duty-cycle loss, and transformer and rectifier stress.
  • Dual Active Bridge (DAB): Bidirectional and isolated, with power transfer set by the phase shift between two full bridges across a high-frequency transformer. Testing a DAB means validating the phase-shift modulation scheme, the ZVS range, soft-start transformer current, efficiency across voltage-gain ratios, minimization of reactive circulating current, and — critically — the dynamics of reversing power flow. Because the control is intricate and the energy levels are high, DAB converters are increasingly validated in real-time simulation before any hardware is energized, which is exactly where Impedyme’s PHIL platform earns its place.

High-Precision Efficiency and Loss Verification Methodologies

As power densities increase, power supply designers target efficiencies exceeding 95% and 98%. Consequently, verifying minor design improvements requires highly precise measurements.

Mathematical Error Propagation in Efficiency and Loss Analysis

When evaluating high-efficiency converters, calculating absolute power loss provides a clearer picture of thermal performance than focusing solely on the efficiency percentage :

$$P_{\text{Loss}} = P_{\text{IN}} – P_{\text{OUT}}$$

For a converter designed to operate at 95% efficiency (η = 0.95), the internal power loss represents 5% of the total input power. If an engineer aims to measure this 5% power loss with a maximum error margin of 5%, the absolute accuracy required for the loss calculation is:

$$\text{Required Accuracy of } P_{\text{Loss}} = 5\% \times 5\% = 0.25\% \text{ of the total power}$$

Standard digital multimeters (DMMs) and electronic loads often exhibit measurement offsets, shunt resistance changes, and thermal drift that exceed these strict limits. For instance, a small 12mA offset in an electronic load’s current readback can introduce severe percentage errors at light loads, distorting the lower end of the efficiency curve.

Implementation of Precision Current Shunts

To achieve the precision required for high-accuracy dc to dc converter test environments, standard electronic load current readbacks should be bypassed in favor of external, high-precision current shunts. Impedyme recommends using two identical current shunts—one on the input rail and one on the output rail. By utilizing identical shunts, any systematic or environmental measurement variations can be balanced out.

These shunts must feature extremely low temperature coefficients (typically 0.02% or less over a 20°C to 70°C operating range) to prevent resistance changes from thermal heating during high-current testing. Designers can perform a quick calibration by linking the converter’s input directly to its output, running a sweep across the current range, and comparing the shunt readbacks to zero out any residual offset or gain errors.

Instrument Consolidation via Source-Measure Units (SMUs)

To reduce the complexity of multi-instrument test racks, Impedyme recommends consolidating separate power supplies, electronic loads, and DMMs into a unified, high-performance system. This is achieved using the Impedyme Series 2600B System SourceMeter SMU or the Impedyme NGM202/NGL202 Power Supplies.

dc dc converter testing impedyme

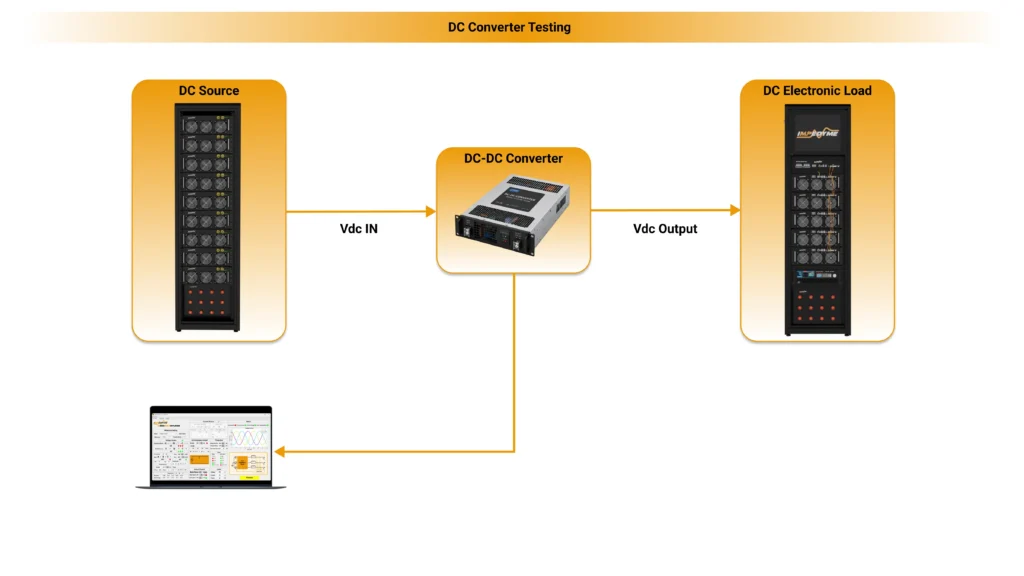
A typical DC-DC converter test setup. Power flows from a programmable DC source into the converter under test (Vdc IN), through the converter, and into a DC electronic load that draws the output (Vdc Output). Rather than relying on an idealized supply and a passive resistor, Impedyme’s platform emulates a realistic source on the input and a dynamic, regenerative load on the output — all configured and orchestrated from GridSim Studio. This lets engineers reproduce the real electrical environment the converter will meet in the field, run efficiency, regulation, transient, and protection sequences automatically, and capture every result for traceability.

Server DC Converter Testing

Server and datacenter power is its own world, and server DC converter testing has become one of the most demanding corners of the field. The architecture has shifted from distributing 12 V to distributing 48 V — and the industry is now beginning to look toward 800 V HVDC distribution — all to cut the resistive losses that dominate at high current.

The efficiency payoff is real and well documented. Hyperscale 48 V rack architectures have demonstrated efficiency improvements on the order of 30% simply by eliminating conversion steps, along with a sharp reduction in distribution losses compared with 12 V. The catch is that conventional two-stage 48 V-to-12 V-to-load conversion has historically peaked around 90% efficiency — which is what drove the development of high-efficiency intermediate bus converters and single-stage 48 V-to-point-of-load designs.

Those intermediate bus converters (IBCs) are typically unregulated 4:1 fixed-ratio stages, and the best of them are remarkable: leading 48 V-to-12 V designs now reach peak efficiencies above 99%, with full-load efficiency in the high-90s. Switched-tank and hybrid switched-capacitor topologies have pushed 48 V-to-12 V conversion firmly into the 98–99% range, and multi-phase coupled-inductor stages routinely deliver close to 98% at full load while supporting fast transient response.

At the bottom of the cascade, the VRM or point-of-load stage steps 12 V (or 48 V directly) down to a sub-1 V core voltage at thousands of amps for a CPU, GPU, or ASIC. Vertical power delivery now pushes current levels toward 100 kA at core voltages in the region of 0.75 V to 0.85 V. Testing here is brutal: millivolt-level deviation tolerances, extreme di/dt transients, current sharing across many phases, and PMBus/AVSBus communication between the converter and the processor it feeds. Industry onboard-power specifications give concrete targets — a load-transient voltage deviation budget around 3% of the output, an output rise time under 10 ms, and a defined current step on the order of 10 A/µs — exactly the kind of spec a server DC converter testing plan must verify.

Looking ahead, emerging 800 VDC datacenter architectures are expected to improve end-to-end efficiency by several percent and to target megawatt-class racks within the next few years, with high-voltage converters already being announced for the transition. These are roadmap targets rather than deployed measured results today, but they signal where high-power DC converter testing is heading — and why test platforms need the bandwidth and power range to follow.

Control Loop Stability and Environmental Robustness Characterization

Ensuring absolute loop stability across a converter’s entire operating envelope requires evaluating its open-loop transfer function within a closed-loop system. This prevents unstable control loop states that can cause catastrophic system failures.

AC Injection Loop Stability Methodology

Because breaking the physical feedback loop of an active converter prevents the controller from regulating the output, loop stability is measured by injecting a small AC disturbance into the closed-loop system. The Impedyme 3225 Frequency Response Analyzer (FRA) injects a swept-frequency AC disturbance voltage across a small-value injection resistor (10Ω to 200Ω) placed in series with the feedback loop path, typically between the output rail and the high-side feedback divider resistor.

The FRA sweeps a small-signal sinusoidal disturbance across a broad frequency band while measuring the input and output response at the injection nodes. From this data, the system plots the open-loop gain (in dB) and phase angle (in degrees) as a function of frequency, producing a Bode plot to evaluate the system’s phase and gain margins.

Alternative Stability Metrics for Closed-Lid Converters

In high-reliability aerospace applications, hybrid space-grade DC/DC converters are hermetically sealed, making physical access to internal feedback nodes impossible. For these “closed-lid” modules, Impedyme utilizes two alternative non-invasive stability evaluation methodologies :

  1. Input Impedance Measurement : By measuring the converter’s input impedance across frequency, engineers can map negative input resistance characteristics. At low frequencies, a switching regulator behaves as a negative resistance : as input voltage increases, input current drops to maintain a constant power output. If this negative input resistance mismatches with the output impedance of the upstream power supply filter, low-frequency front-end oscillations (typically ranging from 600 Hz to 2 kHz) can occur, which can damage the module.
  2. Channel Power Spectral Density Analysis: This non-invasive method acts as a feedback-loop instability indicator. By evaluating the converter’s input voltage noise spectrum with a high-performance spectrum analyzer, engineers measure the total Channel Power magnitude (in dBm) at the phase-crossover frequency (where the loop phase reaches). This method can identify micro-oscillations and low-level loop instabilities that are otherwise invisible on a standard oscilloscope.

Extreme Thermal Environmental Profiling

For aerospace and defense applications, converters must remain stable across military-grade temperature envelopes, typically from −55°C to 125°C. In cryogenic or deep-space missions, this envelope is extended down to −140°C, a region where many commercial and industrial-grade silicon semiconductors fail.

Extreme temperature fluctuations alter internal semiconductor parameters, switching characteristics, and passive component values. These shifts can degrade control loop stability and drift the converter’s switching frequency.

From the Bench to Power Hardware-in-the-Loop

Everything above can be done on a traditional bench: a precision source, an electronic load, a frequency response analyzer, an oscilloscope, and a lot of manual reconfiguration. That approach works, but it has hard limits. The source is an idealized supply, not the real battery or grid the converter will actually see. The load is a passive sink, not a living system that pushes back. Dangerous fault conditions are risky to stage on a full prototype. And every test condition is set up by hand.

功率硬件在环 changes the economics of DC-DC converter testing. In a PHIL setup, a real-time simulation runs a high-fidelity model of the converter’s environment, and a bidirectional power amplifier sources and sinks real current and voltage to the device under test — preserving the natural electrical coupling that signal-level HIL cannot reproduce. The converter does not know it is being tested against a model; it sees real power.

This unlocks tests that are impractical or unsafe otherwise:

  • Source emulation instead of an ideal supply. Rather than feeding the converter from a stiff bench supply, Impedyme’s BatterySim StudioGridSim Studio emulate a real battery, grid, or PV source — with its actual impedance, state of charge, sag, ripple, and fault behavior. This is the only way to reproduce the front-end interaction instabilities that emerge when source impedance is not negligible, the failure mode that no ideal-supply DC converter testing can ever reveal.
  • Realistic, regenerative loads. A motor, a grid tie, or another converter on the output can be emulated as a closed-loop model rather than a passive resistor, so the converter is exercised against the dynamics it will really meet.
  • Safe fault injection. Short circuits, voltage sags, ground faults, and protection-threshold edge cases can be injected through an energy-limited interface and repeated identically, scripted run after run — turning protection testing from a destructive gamble into a repeatable measurement.
  • Closed-loop fidelity at power. For intricate, high-power topologies like DAB and resonant converters, the control scheme can be validated against a faithful real-time plant before the full hardware is ever energized.

Getting PHIL right is an engineering problem in itself, and it is one Impedyme’s platform is built around. The real-time simulator’s time step must be roughly an order of magnitude smaller than the fastest signal it has to represent — for a 100 kHz converter, that means a step on the order of half a microsecond to a microsecond. Impedyme’s FPGA-based CHP platform combines controller-HIL and Power-HIL with update rates fast enough to keep that loop accurate and stable, and the power amplifier characteristics — response time, gain flatness, and phase delay — are specified to keep the PHIL interface from introducing its own instabilities.

Automated Characterization and Reporting

The final differentiator between a good test program and a great one is automation. Manually stepping through every combination of input voltage, output current, and temperature, then capturing efficiency, regulation, ripple, transient, and stability data at each point, is slow and error-prone. A modern DC to DC converter test campaign scripts the entire matrix — multi-dimensional sweeps, drive cycles, ramps, and fault sequences — with automated pass/fail criteria and generated reports.

Impedyme’s PowerHIL Studio drives exactly this kind of campaign. Tests are defined once, run unattended across the full operating envelope, and scored against KPIs automatically, with results captured for traceability. Models and sequences integrate with MATLAB/Simulink, so the same plant model used during control design carries through into validation. The result is a characterization process that is faster, more repeatable, and far broader in coverage than any manual bench routine — and one that scales from a single converter on an engineer’s desk to a full validation rig.

Validate with Confidence Using Impedyme

DC-DC converter testing has outgrown the single-bench-point mindset. Efficiency curves, loop stability across real operating bias, fast transient response, protection behavior under genuine fault conditions, and the increasingly punishing demands of server and EV power all have to be proven across the full envelope — and increasingly against a realistic, emulated environment rather than an idealized supply and a passive load.

That is what Impedyme is built for. From source and battery emulation that reproduces what your converter will actually be connected to, to the FPGA-based CHP platform that exchanges real power with your device in real time, to PowerHIL Studio’s automated, scripted characterization, Impedyme gives power electronics teams a faster, safer, and more thorough path from design to deployment. PHIL doesn’t replace final system-level testing — it de-risks everything that comes before it, so the hardware you build is the hardware that works.

Ready to accelerate your DC converter testing? Talk to the Impedyme team about a PHIL-based validation workflow tailored to your topology, power level, and application.

Advanced Thermal and Mechanical Evaluation Methods

Validating a converter’s electrical performance must be paired with rigorous thermal and mechanical evaluations, as operating temperatures directly impact reliability and lifespan.

To achieve repeatable results during free convection and forced airflow thermal testing, Impedyme recommends several standard setup procedures :

  • Vertical Orientation: For free convection (still air) testing, the converter under test must be oriented vertically. This ensures that natural thermal buoyancy currents can flow unimpeded across the heat-generating components, preventing localized heat pooling.
  • Complete Pin Soldering: The effectiveness of heat transfer from the internal substrate through the connection pins into the system board is highly dependent on copper board area, layer count, and trace thickness. To maximize heat transfer and simulate real-world conditions, all mechanical and electrical pins—including non-functional, NC (no-connect), or duplicate ground pins—must be fully soldered to the test board.
  • Dynamic Efficiency Tracking: Power dissipation varies with input voltage, typically peaking near the minimum and maximum input voltage limits where switching and conduction losses are highest. Consequently, thermal testing must be executed across the entire input voltage range, rather than relying solely on nominal input voltage levels.
  • Critical Component Thermocouple Placement: Standard infrared thermal imaging cannot always capture temperatures beneath components or inside high-aspect-ratio inductors. To monitor internal temperatures accurately, fine-gauge thermocouples should be physically attached to key component “hot spots,” including :
    1. The power switching MOSFET junctions.
    2. The primary and secondary transformer winding cores.
    3. The secondary rectifier output diodes.
    4. The local PCB substrate directly adjacent to the power stage.

These thermocouple points allow engineers to track component temperatures under varying load profiles, verifying that the converter maintains safe operating margins before triggering its over-temperature protection (OTP) circuit.

conclusion

DC/DC converter testing is essential for ensuring that modern power converters deliver the efficiency, stability, reliability, and protection performance required in real-world applications. From evaluating efficiency, regulation, ripple, and transient response to verifying thermal behavior and control-loop stability, a comprehensive test strategy helps engineers identify issues early in development and prevent costly failures in the field. As power systems become more demanding—particularly in data centers, electric vehicles, renewable energy systems, and industrial applications—the need for accurate and repeatable DC-to-DC converter testing continues to grow.

Impedyme helps engineering teams move beyond traditional bench testing by combining advanced source emulation, battery emulation, real-time simulation, and 电力硬件在环(PHIL) technology. This approach enables more realistic and automated dc dc converter testing, allowing converters to be validated against dynamic operating conditions that closely resemble actual deployment environments. Whether your focus is general dc converter testing, a complex DC to DC converter test campaign, or high-performance server dc converter testing, Impedyme provides the tools and expertise needed to accelerate development, reduce risk, and validate power electronics with greater confidence.


常见问题

How do you measure DC-DC converter efficiency accurately?

Efficiency is a small difference between two large numbers, so measuring the loss of a 95%-efficient converter to within a few percent needs roughly 0.06% accuracy at both ports. That requires four-wire Kelvin sensing, synchronized acquisition, and external precision shunts rather than an electronic load’s readback. Above ~99%, calorimetric measurement of dissipated heat becomes more trustworthy than the electrical method.

Why does a converter that passes on the bench become unstable in the field?

Stability isn’t fixed — phase and gain margins shift with load, temperature, and components. A ceramic output capacitor can lose more than half its capacitance under DC bias, collapsing phase margin. There’s also a system-level failure: when source impedance isn’t small relative to the converter’s input impedance, the front end can oscillate even though the converter is fine alone. An ideal bench supply hides this, which is why source emulation with realistic impedance — like Impedyme’s BatterySim Studio and GridSim Studio — is needed to reveal it.

What makes server DC converter testing so demanding?

Server power has moved from 12 V to 48 V distribution, with 800 V HVDC on the roadmap, to cut resistive losses. The point-of-load stage steps down to sub-1 V at thousands of amps, with current pushing toward 100 kA. That means millivolt deviation tolerances, extreme di/dt transients, multi-phase current sharing, and PMBus/AVSBus communication — with specs targeting ~3% transient deviation, sub-10 ms rise time, and 10 A/µs current steps.

How do you test a Dual Active Bridge (DAB) converter?

Testing a DAB means validating its phase-shift modulation, ZVS range, soft-start transformer current, efficiency across voltage-gain ratios, reactive circulating current, and — most critically — the dynamics of reversing power flow. Because the control is intricate and the energy high, DAB converters are increasingly validated in real-time simulation before hardware is energized, which is where a PHIL platform earns its place.

Can you test converter protection features without destroying the board?

Yes. Protection testing — OCP, OVP, OTP, short-circuit, and UVLO — inherently approaches the converter’s destruction limits, which is why an energy-limited interface matters. In a PHIL setup, short circuits, sags, ground faults, and threshold edge cases are injected through a controlled interface and repeated identically, turning protection testing from a destructive gamble into a repeatable measurement.